Plastic pollution has emerged as a pervasive and escalating environmental crisis, impacting marine ecosystems from the surface to the deepest trenches and posing potential risks to human health.
Scale and Distribution of Marine Plastic
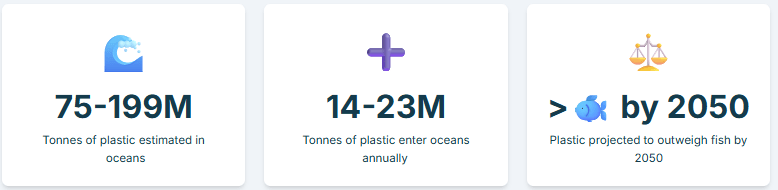
The sheer volume of plastic waste in the global ocean is staggering, with estimates ranging from 75 to 199 million tones currently present. This existing burden is compounded by an alarming annual input of plastic, with approximately 14 million tones (33 billion pounds) entering the marine environment each year. The United Nations Environment Program (UNEP) estimates that 19-23 million tones of plastic waste leak into aquatic ecosystems annually.
Projections indicate that the volume of plastic pollution entering the ocean could double or triple by 2040 , and by 2050, plastic is expected to outweigh all fish in the sea by weight. Plastics constitute the bulk of marine litter, accounting for at least 85% of total marine waste.
A critical understanding of marine plastic distribution is that:
- About 1% of the total plastic litter entering the ocean remains at the surface;
- 99% sinks or drifts beneath the surface or lies on the seafloor. Some estimates suggest there could be 10,000 times more plastic on the seabed than floating on the surface. This challenges the common perception of surface-only “garbage patches” and reveals a pervasive, three-dimensional contamination of the entire water column and seabed.
Plastic debris exists in various forms. Commonly found items include:
- Fishing gears
- Single-use bottles
- Food wrappers
- Cigarette butts
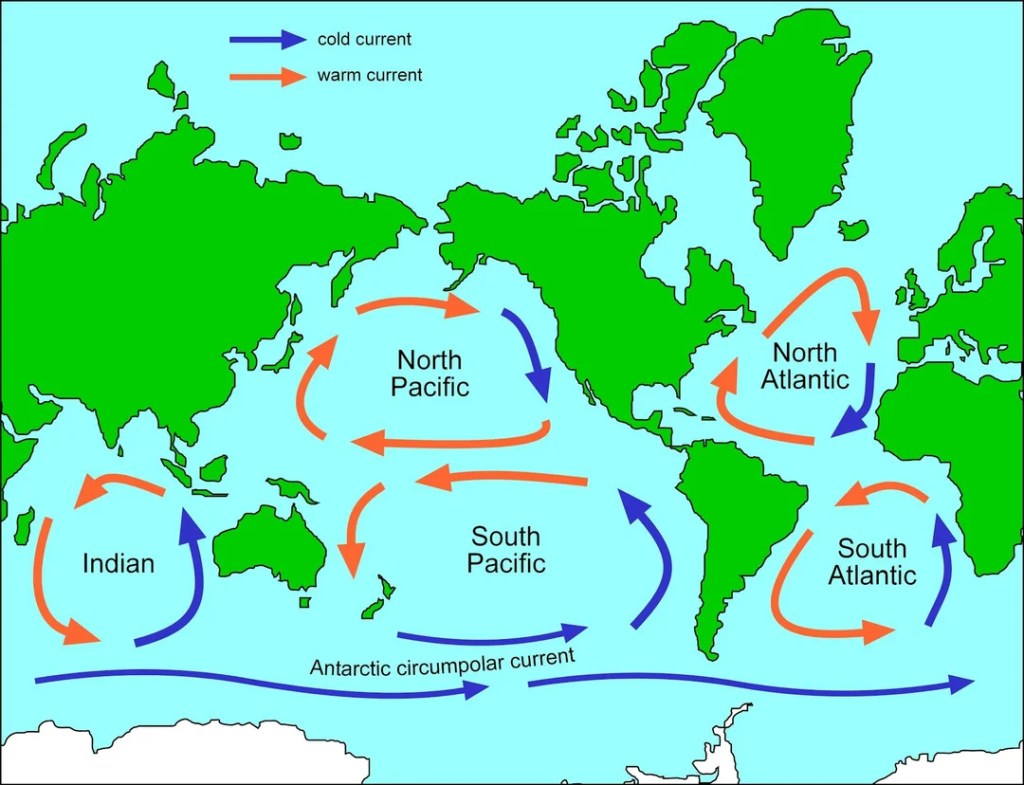
The five major ocean gyres (one in the Indian Ocean, two in the Atlantic, and two in the Pacific) are known accumulation zones for plastic debris.
The substantial presence of subsurface microplastics has been observed in both nearshore and offshore waters, with concentrations reaching 1,100 particles per cubic meter at 100-270 m depth in the Atlantic, and as high as 25,200 particles per cubic meter at 2,500 m depth in the Arctic. Microplastic prevalence in particulate organic carbon (POC) increases with depth, from 0.1% at 30 m to 5% at 2,000 m, indicating their integration into fundamental ocean biogeochemical processes. This pervasive distribution, especially of microplastics at extreme depths like the Mariana Trench , confirms a widespread and insidious problem that extends far beyond visible surface debris.
Primary Sources and Pathways
The exponential growth in global plastic production is a fundamental driver of marine plastic pollution.
Production doubled between 2000 and 2019, from 234 to 460 million tonnes, and is projected to reach 736 million tonnes by 2040, a 70% increase from 2020 levels. The majority of this plastic (two-thirds of the average 430 million tonnes produced annually) is designed for short-term use. This massive volume of short-lived plastic, coupled with inefficient waste management systems, inappropriate disposal methods, and a general lack of awareness, creates a systemic failure in the linear plastic economy.
Globally, only 15% of plastic waste is collected for recycling, with less than 9% actually recycled after losses. For plastic packaging, which accounts for 36% of plastic production, the recycling rate was only 13.6% in 2018, significantly lower than for other materials like paper (80.9%) or aluminum (34.9%). This pervasive failure to manage plastic waste effectively results in the equivalent of over 2,000 garbage trucks full of plastic being dumped into the world’s aquatic ecosystems every day.
While 70-80% of marine plastic debris originates from land-based sources, primarily through littering and indiscriminate dumping , a critical insight for targeted intervention is that 90% of riverine plastic emissions into the ocean come from just 10 rivers, eight of which are in Asia and two in Africa. This highlights highly concentrated leakage points that, if addressed, could significantly reduce ocean input.
Table 3: Global Plastic Pollution Overview
| Metric | Value |
| Estimated Plastic in Oceans | 75-199 million tonnes |
| Annual Plastic Input to Oceans | ~14-23 million tonnes |
| Projected Volume by 2050 | Outweighs all fish (by weight) |
| Percentage of Marine Litter that is Plastic | 85% |
| Percentage of Plastic that Sinks | 99% |
| Global Plastic Production (2019) | 460 million tonnes |
| Projected Global Plastic Production (2040) | 736 million tonnes |
| Plastic Packaging as % of Production | 36% |
| Plastic Packaging Recycling Rate (2018) | 13.6% |
This table provides a concise summary of the scale and trajectory of plastic pollution, emphasizing the current burden and future projections. It also includes key statistics on recycling rates and composition, highlighting the systemic nature of the problem and the need for upstream interventions.
Marine-based sources also contribute substantially to plastic pollution, often overlooked in public discourse. Discarded fishing nets and equipment, commonly known as “ghost gear,” are a major cause of plastic pollution in the ocean, continuing to entangle and kill marine animals long after they are abandoned.
Container wrecks have also become a significant source, with at least 1 trillion raw plastic pellets lost at sea in eight maritime disasters since 2011. Furthermore, an estimated 100,000 tonnes of microfibers are shed annually from synthetic clothing washed in ships’ onboard laundries and discharged into the sea as unregulated greywater. These diverse and often hidden sources underscore that addressing plastic pollution requires a multi-pronged approach that goes beyond consumer waste to encompass industrial practices and marine-based activities.
Environmental and Health Impacts
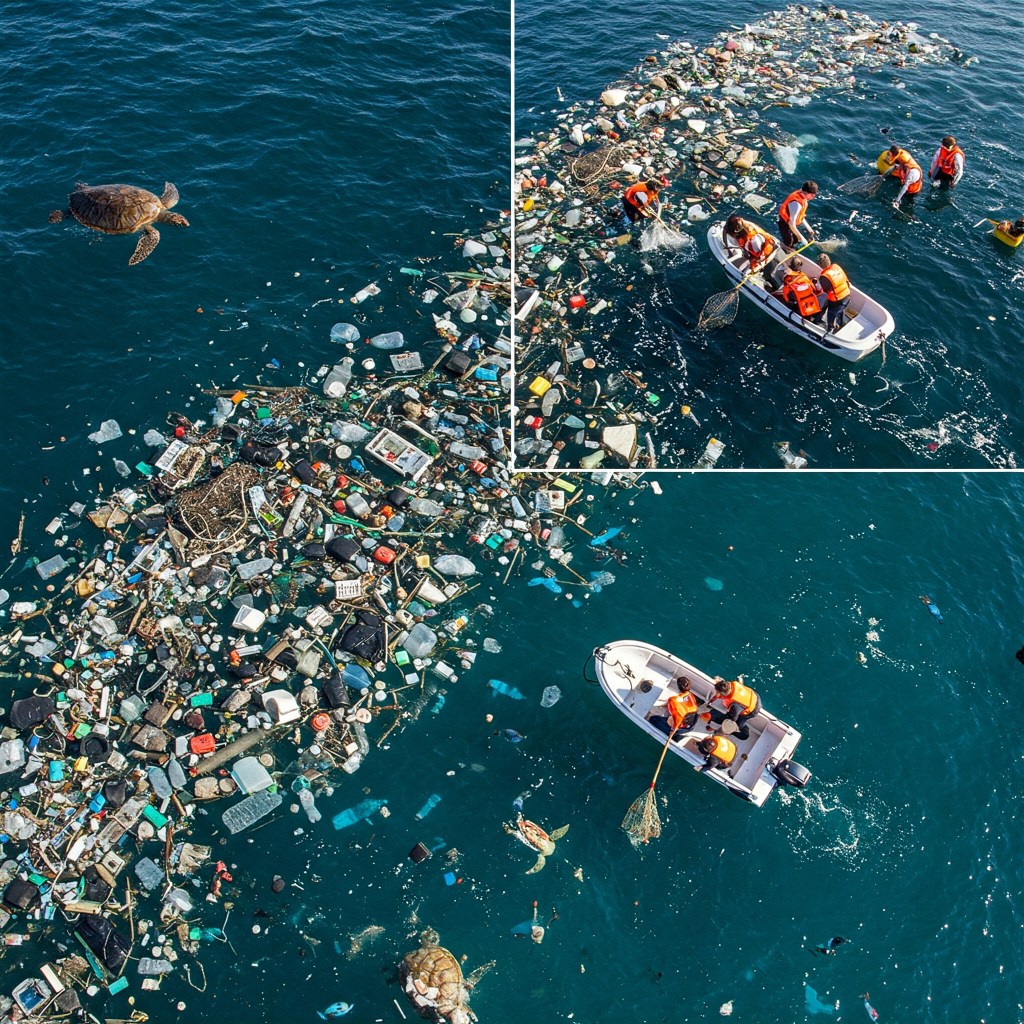
The impacts of plastic pollution on marine life are extensive, ranging from direct mortality to chronic physiological harm across all trophic levels. Marine animals suffer from entanglement, suffocation, starvation, and drowning due to larger plastic debris.
An estimated 100 million marine animals die each year from plastic waste alone, with 100,000 deaths attributed to entanglement. One in three marine mammal species are found entangled in litter.
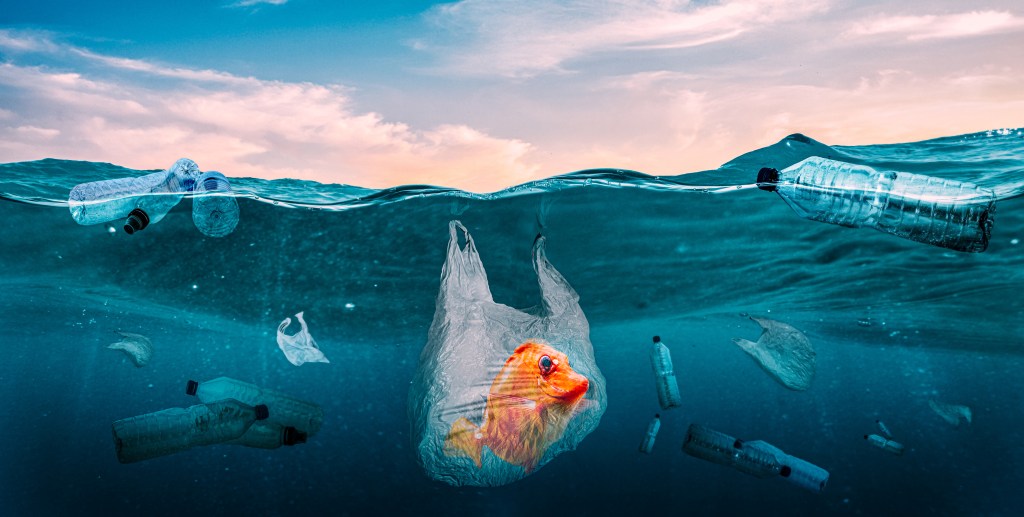
Ingestion of plastic is a pervasive threat:
- Sea turtles frequently mistake plastic items like bags and balloons for prey, and ingesting too much buoyant plastic can cause them to become positively buoyant, unable to dive for food, leading to starvation or increased vulnerability to predators and boat strikes.
- Whales have been documented with balloons lodged in their digestive tracts, inhibiting feeding.
- A new medical term, “plasticosis,” has been coined to describe plastic-induced fibrosis in seabirds, where the rough edges of ingested plastic cause internal injuries and scarring, hindering digestion and making birds more susceptible to illness.
Two-thirds of all fish species studied, including those consumed by humans, have ingested microplastics, with 12-14,000 tonnes ingested by North Pacific fish annually. The presence of microplastics has even been confirmed in deep-sea cold-water corals and hydrothermal vent communities, unique and vulnerable ecosystems.
Beyond direct harm to marine life, plastic pollution poses significant risks to human health. The presence of microplastics and their associated chemical contaminants in seafood raises concerns about their transfer through the food chain to humans, with potential links to health issues such as cancer, infertility, and nervous system damage. Studies indicate that the ingestion of microplastics is greatest in fishing communities and populations heavily dependent on a seafood diet, highlighting a disproportionate burden on vulnerable human populations. For example, suspected microplastic particles were found in all samples from live bottlenose dolphins, and oysters were found to accumulate tire particles faster than other microplastics. This direct link between marine plastic pollution and human well-being adds another layer of urgency to mitigation efforts. Furthermore, plastic pollution can alter habitats and natural processes, reducing ecosystems’ ability to adapt to other environmental stressors like climate change.
Mitigation Efforts and Cleanup Technologies
Addressing the plastic pollution crisis requires a multi-faceted approach encompassing policy, technological innovation, and behavioral change. International policy efforts are gaining momentum, with the Intergovernmental Negotiating Committee (INC) working towards a legally binding instrument on plastic pollution, initially aimed for finalization by the end of 2024 but extended into 2025 due to significant differences among nations.
Over 100 countries is advocating for binding commitments to reduce plastic production and eliminate harmful chemicals, with proposals for global targets on primary plastic polymer reduction and mandatory reporting on plastic production gaining traction.
Studies shows that by curbing production and demand to promoting eco-design, enhancing recycling, and closing leakage pathways can nearly eliminate plastic leakage by 2040 and quadruple the average global recycling rate from 9.5% to 42%. This emphasizes that strategies focusing solely on waste management without reducing waste generation are unlikely to succeed. This underscores the imperative of upstream intervention and a fundamental shift towards a circular economy.
Policy and regulatory innovation
Extended Producer Responsibility (EPR) schemes are a cornerstone of modern plastic policy, shifting the financial and operational responsibility for post-consumer packaging collection, logistics, and recycling from local municipalities directly onto the producers of packaged products.
A notable aspect of the policy landscape is the significant divergence in approaches, particularly regarding “chemical recycling.
Taxes and economic incentives serve as powerful deterrents and motivators. Governments can impose taxes on the production or use of single-use plastics or offer tax breaks, subsidies, and other fiscal incentives to encourage the adoption of alternatives.
Single-use plastic bans are among the most widely used and successful legal mechanisms, directly prohibiting the production, distribution, or use of certain plastic products.
Product standards and labeling requirements are crucial for informing the public and guiding sustainable choices.
Another important development in policy is the increasing granularity and performance-based nature of regulatory targets. The EU Single-Use Plastics Directive and the U.S. Department of Energy’s Strategy for Plastics Innovation exemplify this trend. These policies move beyond broad aspirational goals to establish highly specific, time-bound, and quantitative obligations for industry, such as mandated recycled content percentages, precise collection rates by specific years, and measurable energy and carbon metrics.
Comparative Analysis of Key Policy Innovations and Their Global Impact
| Policy Type | Key Regions/Countries | Mechanism/Key Provisions | Reported/Targeted Impact |
|---|---|---|---|
| Single-Use Plastic Bans | EU, India, Chile, Panama, Germany, France, Sweden, Estonia, Malta, Greece, Ireland | Direct prohibition of items like straws, cutlery, plates, cotton buds, plastic bags. | Widespread reduction in consumption; India: nationwide ban in 2022; Chile: first in S. America to fully ban (2021); Panama: plastic bag ban (2018) |
| Plastic Taxes/Economic Incentives | Portugal, Denmark, EU, Italy, Spain | Taxes on producers/consumers of single-use plastics; tax breaks/subsidies for alternatives; weight-based packaging taxes. | Portugal (2015): ~$0.12/bag tax led to 74% decrease in consumption; Denmark (1999): weight-based tax, lower for recycled plastic; EU (2021): plastic tax on non-recycled waste |
| Extended Producer Responsibility (EPR) | Germany, US (Maine, Oregon, California, Colorado, Minnesota), South Africa, Nigeria, EU | Shifts financial/operational responsibility for post-consumer waste to producers; fees based on distributed products. | Germany (1991): 1 million metric tons waste reduction by 1998; US states: PROs empowered to develop statewide plans; EU: mandated for beverage containers |
| Recycled Content Mandates | EU | Requires specific percentages of recycled content in new products. | EU: 25% recycled content for plastic bottles by 2025, 30% by 2030; US DOE SPI: aims for cost-competitive recyclable-by-design solutions |
| National Plastic Action Plans (NPAPs) | Indonesia, India, UAE (Dubai), Ghana, US (EPA Strategy, DOE SPI) | Comprehensive policy frameworks integrating innovation, regulation, public-private partnerships, and community engagement. | Indonesia: aims to reduce marine plastic leakage by 70% by 2025; UAE: targets zero plastic waste by 2031; US EPA: aims to eliminate plastic leakage by 2040 |
Technological solutions available
Technological solutions for cleaning up existing plastic pollution are also advancing, some examples:
- The Ocean Cleanup, has developed U-shaped floating barrier systems that aim to remove 50% of the plastic in the Great Pacific Garbage Patch within five years of deployment. By 2024, they had removed over 15 million kilograms of plastic from oceans.
- Their Interceptor system, a solar-powered catamaran, is deployed in polluted rivers to prevent plastic from reaching the ocean, having removed over 2.2 million pounds of trash from rivers in several countries.
- Other innovations include Mr. Trash Wheel in Baltimore Harbor and Bubble Barriers in European canals, which effectively capture riverine plastic before it enters the sea.
- Predictive Modeling: Beyond detecting existing pollution, AI plays a crucial role in forecasting future plastic accumulation. By integrating data on oceanic currents, wind patterns, and river outflow, AI-powered predictive models can anticipate where plastic waste is likely to accumulate, thereby speeding up future cleanup operations. The Poseidon Plastic Tracking System exemplifies this.
- Autonomous vessels, drones equipped with AI and sensors, and satellite systems are enhancing surveillance, detection, and collection efficiency for marine plastic.
- Advancements in biodegradable materials, such as polyhydroxybutyrate film that can degrade in seawater and seaweed-based sachets, offer promising alternatives to conventional plastics.
- AI in Recycling Plant Operations: AI-powered sorting systems, leveraging image recognition and deep learning, can distinguish between different types of plastics (e.g., PET, HDPE, PVC), metals, and paper with significantly greater accuracy and speed than traditional manual methods. This precision reduces contamination and increases the purity and value of recycled materials.
- Furthermore, autonomous waste bins equipped with AI, such as MyMatR, are improving sorting at the point of disposal, preventing contamination before waste even reaches a facility.
While these technological solutions are impressive and contribute to cleanup efforts, they are primarily downstream interventions. Given the vastness of the ocean and the pervasive subsurface distribution of plastic, especially microplastics, cleanup technologies alone cannot solve the problem; they must be part of a broader, integrated strategy that prioritizes prevention at the source.
Community action
At SaveOCEAN we promote real actions and launching the following programs:
- Green Choice Challenge
- Plastic-Free Ambassadors
- ReThink Reusables Program
- Tech-Driven Transparency for plastic proof platform
- Build the Ocean Guardians Network
Do you want to make an impact?
Contact us to be part of the change: Contact

Leave a comment