Summary of findings which you may have missed based on the report: Marine litter in Europe: An integrated assessment from source to sea (published 2023).
When you skim a big official report about marine litter, it can feel neutral and technical—lots of graphs, indicators, and acronyms. But underneath that calm surface there’s always a story about why the ocean is full of plastic and who needs to change.


The quiet storyline: “Litter is just mismanaged waste”
The report’s main message is subtle but powerful:
Marine litter happens because waste is mismanaged.
From the opening pages, the report defines marine litter primarily as the end result of mismanaged waste and “inadequate production and consumption, waste disposal behavior and waste management.”
That sounds reasonable, but it embeds several assumptions:
Waste management is the central causal lever.
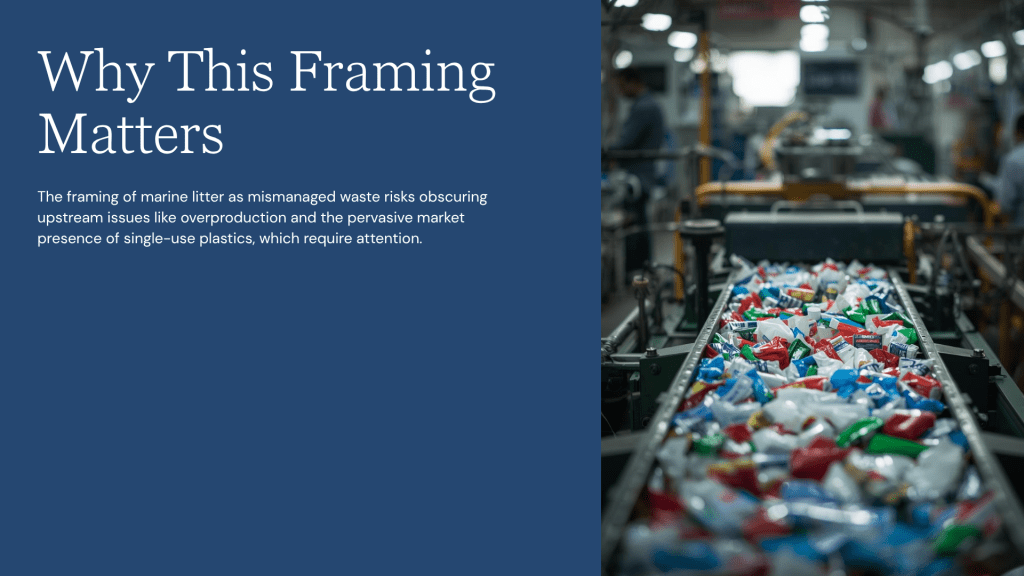
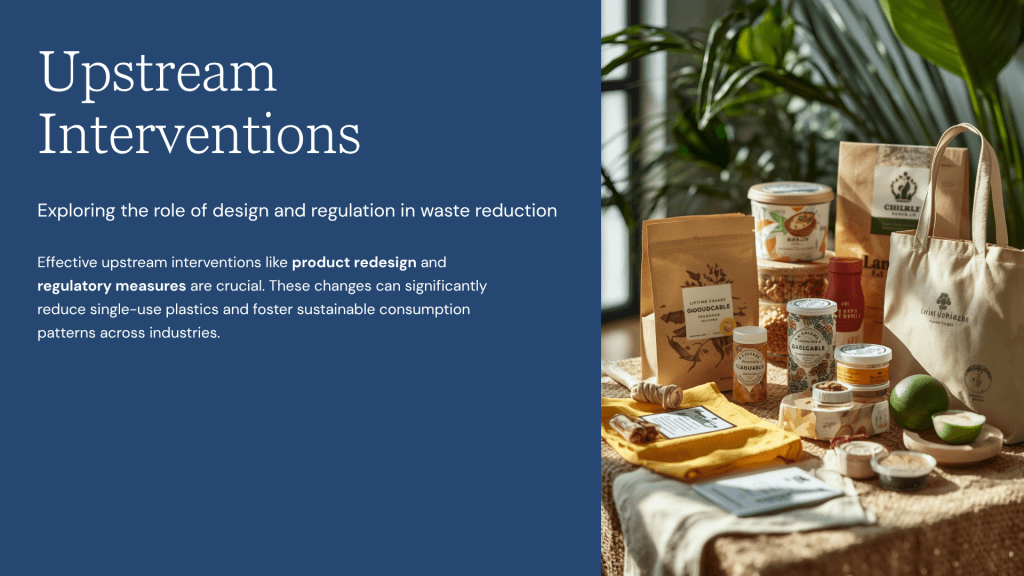
If litter is “mismanaged waste,” then the fix is better bins, better collection, better recycling. The real upstream problem—we are producing way too many single-use plastics—is treated as background noise.
The problem is primarily one of system efficiency, not power.
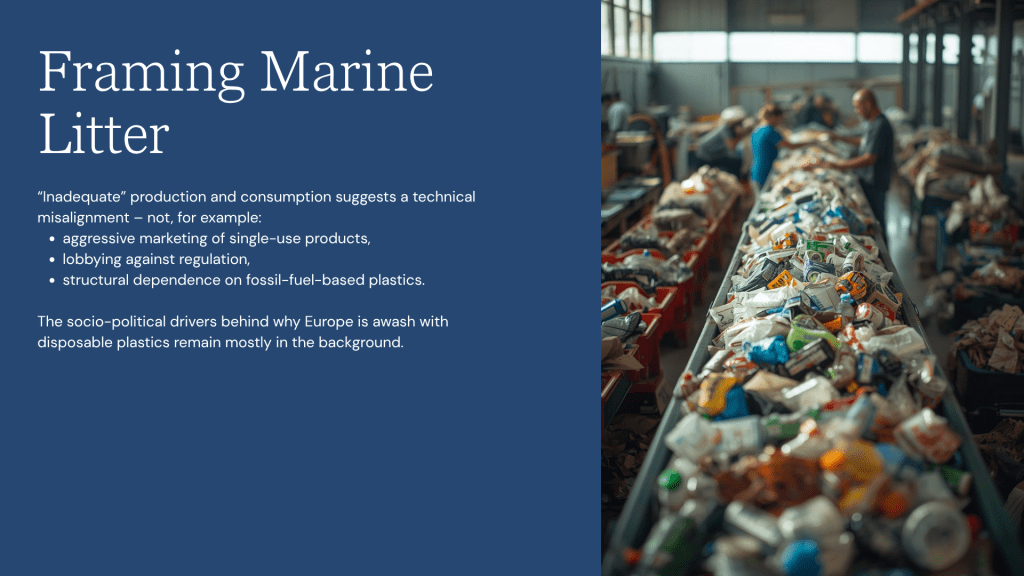
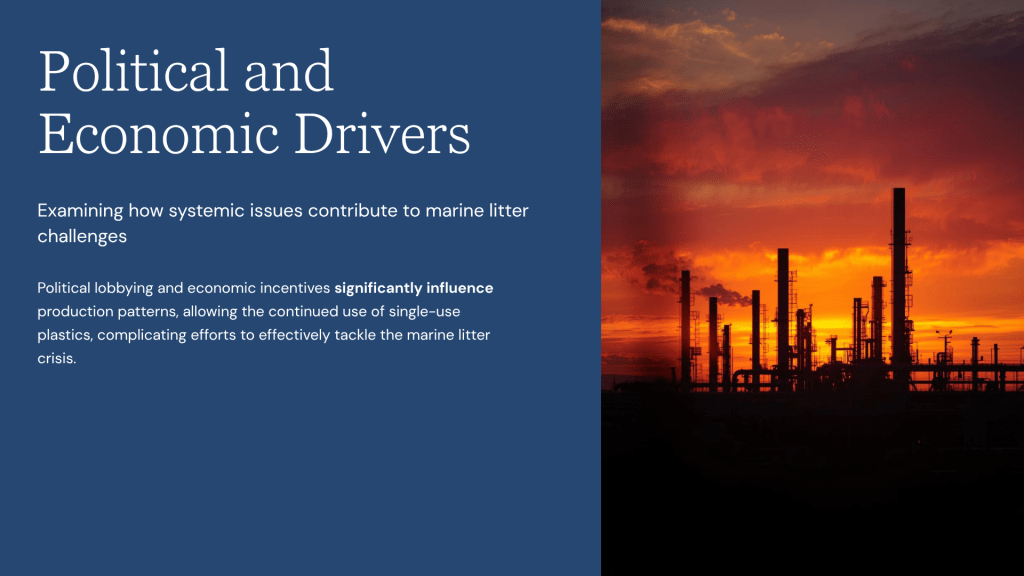
“Inadequate” production and consumption suggests a technical misalignment – not, for example, aggressive marketing of single-use products, lobbying against regulation, or structural dependence on fossil-fuel-based plastics. The socio-political drivers behind why Europe is awash with disposable plastics remain mostly in the background.
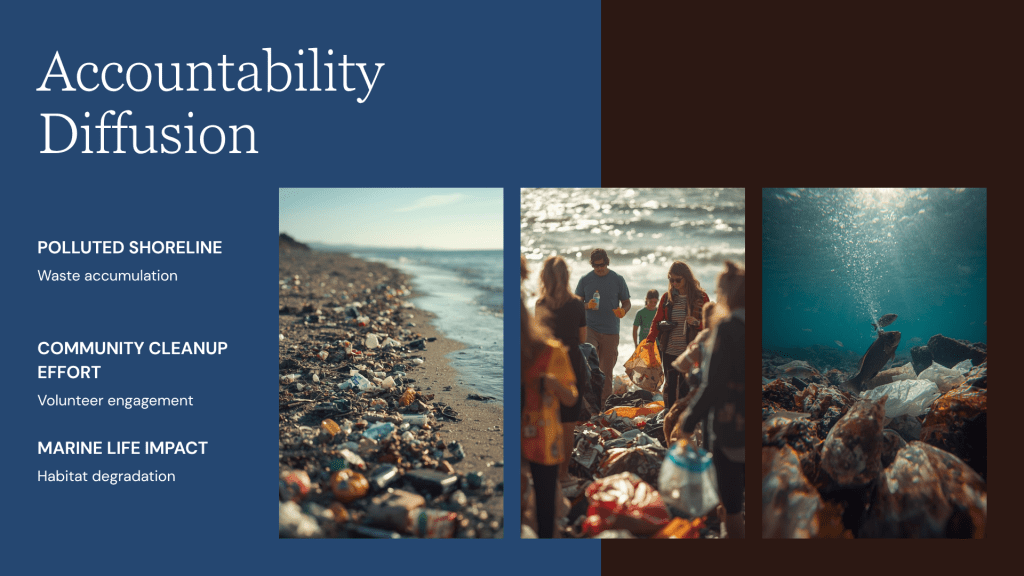
Responsibility is diffused across “society”.
The report often says things like “European society produces, uses and disposes plastics.” That language blurs the line between a family buying food wrapped in plastic and a corporation designing that packaging in the first place. Everyone is “a little responsible,” which can mean no one is truly accountable.
Why this matters:
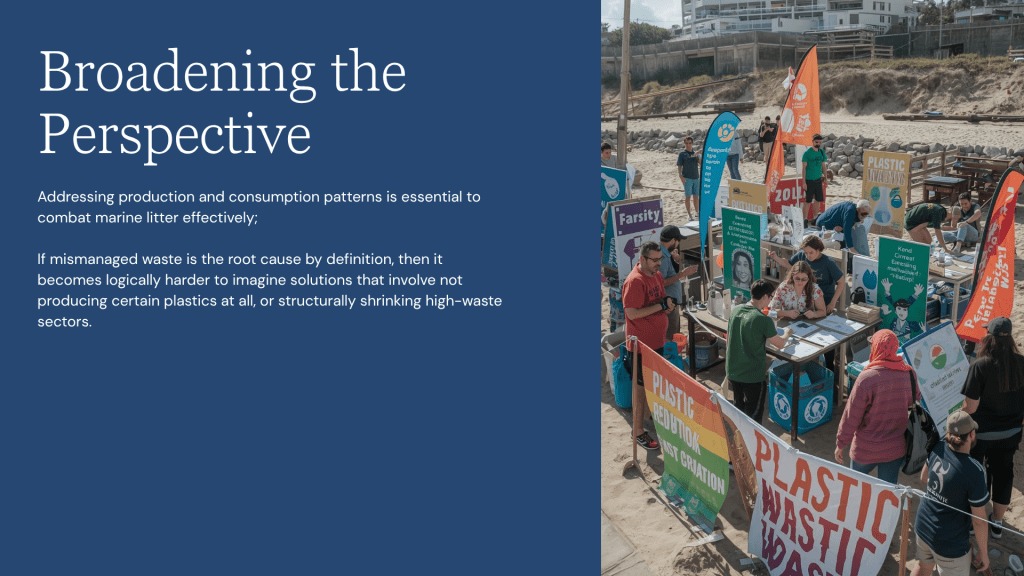
If mismanaged waste is the root cause by definition, then it becomes logically harder to imagine solutions that involve not producing certain plastics at all, or structurally shrinking high-waste sectors.
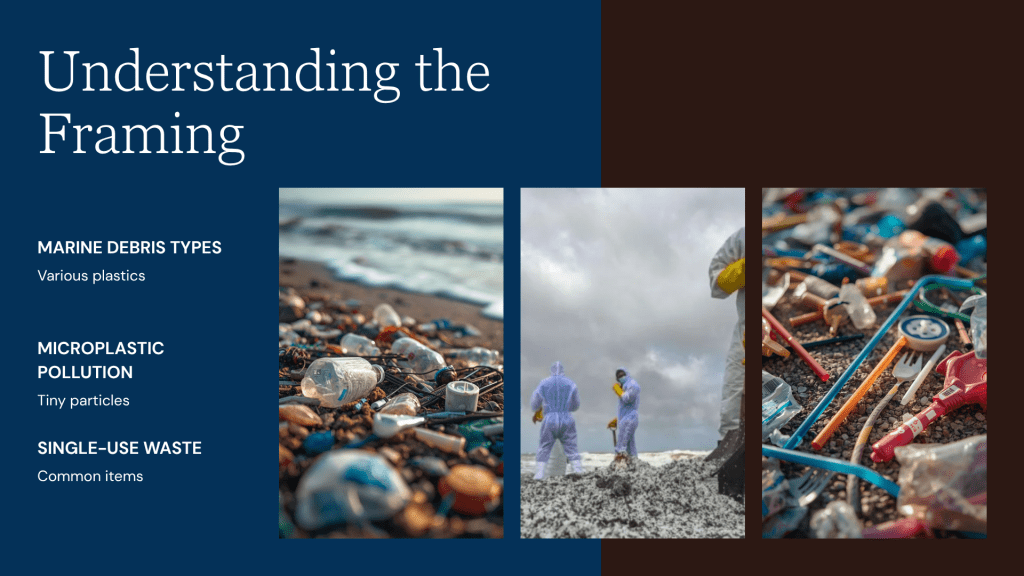
The frameworks: helpful maps with blind spots
The report is organized using a “source-to-sea” approach and the DPSIR model (Drivers → Pressures → State → Impacts → Responses).
That sounds smart and comprehensive—but the way these tools are used shapes what we see.
What they do well
- Connect land, rivers and sea.
- Show how economic activity ends up as pressure on the marine environment.
- Keep track of policies and responses.
What they quietly hide
- Power and politics vanish.
“Drivers” are GDP, plastic production, tourism numbers—not corporate lobbying, trade deals, or political decisions that allow harmful products to stay on the market. - People’s lived realities are flattened.
Fishing communities, coastal residents, and waste workers are bundled into generalized “sectors” and “consumers.” Their different levels of risk and exposure are barely visible. - Justice is sidelined.
The model tracks environmental state and pollution levels, but not who pays the price—financially, socially, or with their health.
These frameworks are useful maps. But like any map, they leave things out—and what’s missing is often about power, inequality and responsibility.
The big choice: putting packaging at the centre
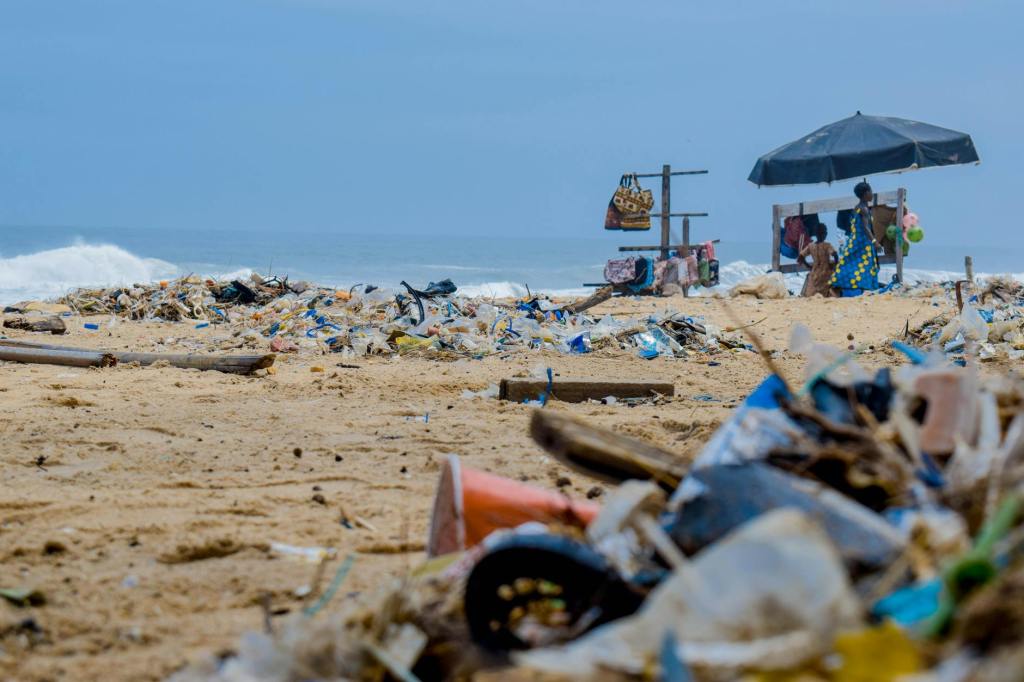
The report zooms in on one main villain: PPSI (plastic packaging and small non-packaging items)—bottles, wrappers, bags, cigarette butts and so on because they dominate post-consumer waste and beach counts.
This makes sense; they show up all over beaches. But this choice quietly shapes the entire story.
What this focus reveals
- Everyday, post-consumer plastic is everywhere.
- Tourism, food packaging and on-the-go products are clearly major culprits.
- Waste systems and littering are easy to connect to what we see on the shore.
What this focus hides
- Other major sources get pushed offstage.
Ghost nets, industrial pellets, inadequate sewage systems or aquaculture, microplastics from rubber products and textiles, shipping containers lost at sea—these are acknowledged, but they are not the backbone of the analysis. - Blame leans toward individual behavior.
By centering packaging and small items, the narrative quietly leans toward “people littering on beaches,” not “companies saturating markets with disposable stuff and designing products that are impossible to reuse or repair.” - Non-plastic litter disappears.
Metal, glass and other materials are part of the problem too, especially for safety and wildlife, but plastic dominates the spotlight.
The report is incredibly useful if you’re fighting plastic packaging, but less suited to judging the full spectrum of marine litter causes including fishing gear, shipping, pellets, or systemic fossil-plastic production.
When numbers look neutral but aren’t
The report is full of impressive indicators and model results: mismanaged waste per capita, status of coastal waters, trends between 2012 and 2018, and more.
Yet several methodological decisions carry hidden assumptions:
Mismanaged waste and littering rates
To estimate how much plastic can leak to the ocean, the report uses:
- National waste statistics
- Assumed plastic share in municipal waste
- Assumed share of that plastic that is packaging and small items
- Assumed littering and mismanagement rates
Those “assumed” parts matter. They often come from limited studies or generic values applied to multiple countries. That means:
- The resulting maps look very precise—but the certainty is not as high as the graphics suggest.
- Local hotspots (illegal dumping, weak enforcement, informal waste commerce) can vanish into national averages.
Status assessments and thresholds
For the marine environment, the MALT tool classifies grid cells as “High/Good” vs “Moderate/Poor/Bad” based on beach, seafloor and microliter indicators.
Less obvious assumptions:
Thresholds encode value judgements.
What counts as “Good status” is not a purely scientific boundary; it is a negotiated policy choice. The report treats these thresholds as technical inputs, not as contested social decisions.
Partial spatial coverage stands in for whole seas.
Only about 19–25 % of coastal and marine areas could be assessed, but the resulting status is often discussed at the scale of whole regional seas (“the situation is worse in the Black Sea and Mediterranean Sea…”). That assumes the sampled cells are representative, which is uncertain given known hot- and cold-spots.
The “worst indicator wins” rule may bias results.
Taking the lowest Ecological Quality Ratio across indicators ensures a conservative assessment, but it also embeds a precautionary bias: one problematic metric dominates even if others are improving. This is a policy-relevant choice, not a neutral one.
Policy narrative and institutional perspective
Enforcement and political pushback are barely mentioned.
We hear a lot about what policies “aim” to do, and far less about how strongly they are enforced, where they fail, or where industry pressure has weakened them.
EU laws are the heroes.
Directives, strategies and action plans are described as the main tools for change. That’s fair—but it underplays how much European consumption relies on plastics produced, used and dumped outside the EU.
“Integration” is seen as the main fix.
If Marine Strategy, Circular Economy, Zero Pollution and other policies line up better, things will improve. That may be true, but it assumes those policies are ambitious enough in the first place.
Soft language around politically sensitive sectors.
Tourism, shipping, fishing and aquaculture are shown to be significant contributors to litter, yet the wording is careful: “tourism is known to exert intense environmental pressure,” “ship-generated waste can pose a significant threat if disposed of inadequately.” There is little direct discussion of regulatory enforcement gaps or economic interests resisting change.
Take away: The system is mostly evaluating itself using indicators it designed. We should celebrate when it works—but we shouldn’t treat its own metrics as the final word on whether the ocean is being protected.
Behavior vs. systems: where the report points the finger
All through the report, certain ideas keep resurfacing:
- Littering is a key problem.
- Consumer awareness and behavior need to change.
- Waste management needs upgrading.
All true—but notice what barely appears:
- The role of aggressive marketing of single-use products
- The lack of refill / reuse infrastructure
- Oversupply of cheap virgin plastic
- Unequal impacts on poorer regions and coastal communities
When these deeper issues stay in the background, we slide into a familiar script:
“If only people recycled more and stopped littering, the sea would be fine.”
At SaveOCEAN, we believe in personal responsibility. But we also know:
We can’t talk about “Europe” as one block when some regions and communities bear far more pollution and far fewer resources to deal with it.
How to use this report for real ocean protection and push the conversation upstream
- Which communities bear the highest cleanup costs, health risks, or loss of livelihoods?
- How coastal economies shaped by plastic-intensive tourism drive both local litter and political resistance to stricter regulation?
- How selected indicators fully capture progress toward the stated political ambitions of “zero pollution”?
- Why was so much disposable material produced in the first place?
- Who profits from that system?
- What would it look like to phase out entire categories of single-use plastics, not just manage their waste better?
Conclusion
The Marine litter in Europe report is meticulous, data-rich and transparent about many limitations. Yet underneath the calm tone is a story that matters for all of us fighting for clean seas:
- It sees policy integration, more than it sees power imbalances..
- It sees waste, more than it sees overproduction.
- It sees indicators, more than it sees inequality.
Our job at SaveOcean.net isn’t to dismiss this kind of work—it’s to decode it, use the data it offers, and then push the conversation further:
- From “how do we manage all this waste?”
to - “how do we stop drowning the ocean in plastic in the first place?”
That’s the shift the ocean needs—and that’s the gap we’re here to keep pointing at, loudly, until it closes.

Leave a comment